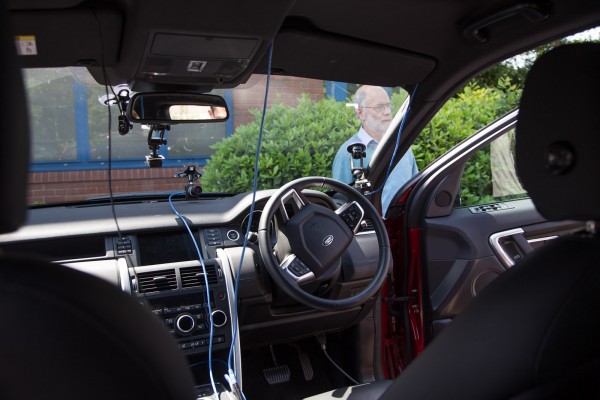
The project I’m currently involved in at the University Computer Lab is investigating how we can make use of some of the lab’s computer vision and human interface expertise to improve the experience for car drivers. This is being done in conjunction with Jaguar LandRover, and we’ve been equipping a Discovery with several cameras, some looking at the driver and passengers, some at the surroundings.
We can also record various bits of other telemetry from the car’s internal CAN network, and some of the cameras are synchronised to this, but not all of them.
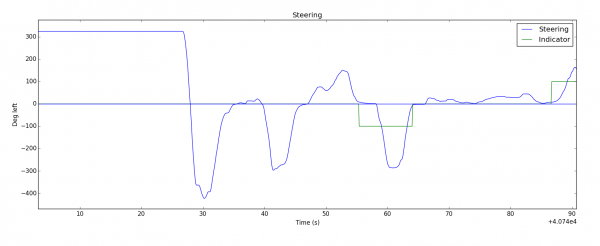
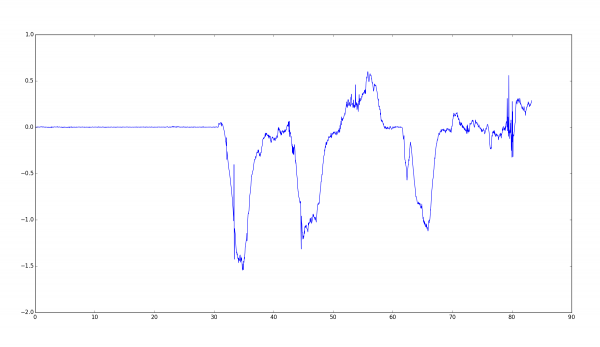
My knowledge of computer vision techniques is about a quarter of a century out of date, so as part of a learning experiment today I was thinking about ways of automatically synchronising the video to the data. The two graphs below show the first minute and a half of a recording, starting with the stationary car moving off and going through a couple of turns. This isn’t how we’ll eventually do it, but it was a fun programming experiment!
This first plot shows the angle of the steering wheel, as recorded by the car’s own sensors.
This second plot shows the average horizontal component of optical flow seen by one of the front-facing cameras: in essence, it’s working out whether more of the pixels in the view that the driver sees are moving left or right.
I’m quite pleased that these two completely independent sources of data show such a nice correlation. Optical flow is, however, pretty time-consuming to calculate, so I only got through the first 90 seconds or so of video before it was time for dinner.
Fun stuff, though…


