If you go to a bus stop where the bus arrives, on average, every 10 minutes, how long will you wait?
5 minutes, on average, right?
Wrong.
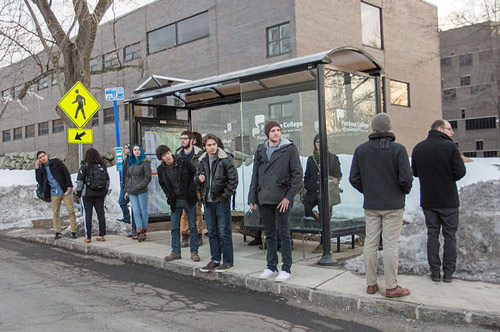
This is an example of The Inspection Paradox, a phenomenon of which I was dimly aware, but I came across some nice examples in my reading this morning – and it’s an important thing to understand.
You see, 5 minutes would be the right answer if the bus came at exactly evenly-spaced 10 minute intervals. But this doesn’t happen, at least, not outside Switzerland. So the gaps may be bigger or smaller.
If you arrive at a random time, you are more likely to hit one of the bigger gaps. The average waiting time that you, as a passenger, will experience, will therefore be higher. (Python programmers interested in a detailed analysis of this example could take a look at this blog post. If the arrival time follows a reasonably long-tailed Poisson distribution — admittedly unlikely in this particular example — then your average wait could actually be as high as 10 minutes.)
Allen Downey’s blog has a range of other nice examples in here. You can read the whole thing if you want the details, but here are a few excerpts of the key points:
A common example is the apparent paradox of class sizes. Suppose you ask college students how big their classes are and average the responses. The result might be 56. But if you ask the school for the average class size, they might say 31. It sounds like someone is lying, but they could both be right.
Basically, if you sample students at random, you are often more likely to hit students in larger classes, and that will skew your statistics if you are trying to determine the actual average class size.
That’s not necessarily a mistake. If you want to quantify student experience, the average across students might be a more meaningful statistic than the average across classes. But you have to be clear about what you are measuring and how you report it.
Here’s another travel-related example:
The same effect applies to passenger planes. Airlines complain that they are losing money because so many flights are nearly empty. At the same time passengers complain that flying is miserable because planes are too full. They could both be right. When a flight is nearly empty, only a few passengers enjoy the extra space. But when a flight is full, many passengers feel the crunch.
The Inspection Paradox is relevant to social networks, too – real or virtual.
In 1991, Scott Feld presented the “”friendship paradox””: the observation that most people have fewer friends than their friends have.
If you think that everyone you know has a wider social circle than you do, it’s because you are simply more likely to be in the social circles of people with bigger social circles.
That may or may not make you feel better, but at least you now have a name for it!
Photo: Frank Hank
Update, a few days later:
As I sit in a long phone queue waiting to talk to BT, my broadband provider, I ponder just how often, on such calls, I hear the phrase, “We are experiencing a large number of calls at the moment, and we apologise for the delay…” I have often thought, that, since they always seem to be experiencing an unusually large number of calls, perhaps they need to employ some more people.
But then I realise, of course, that I am one of those large numbers. It is natural that people will experience this more often than not, because more people will be calling during the periods when more people are calling…


Recent Comments